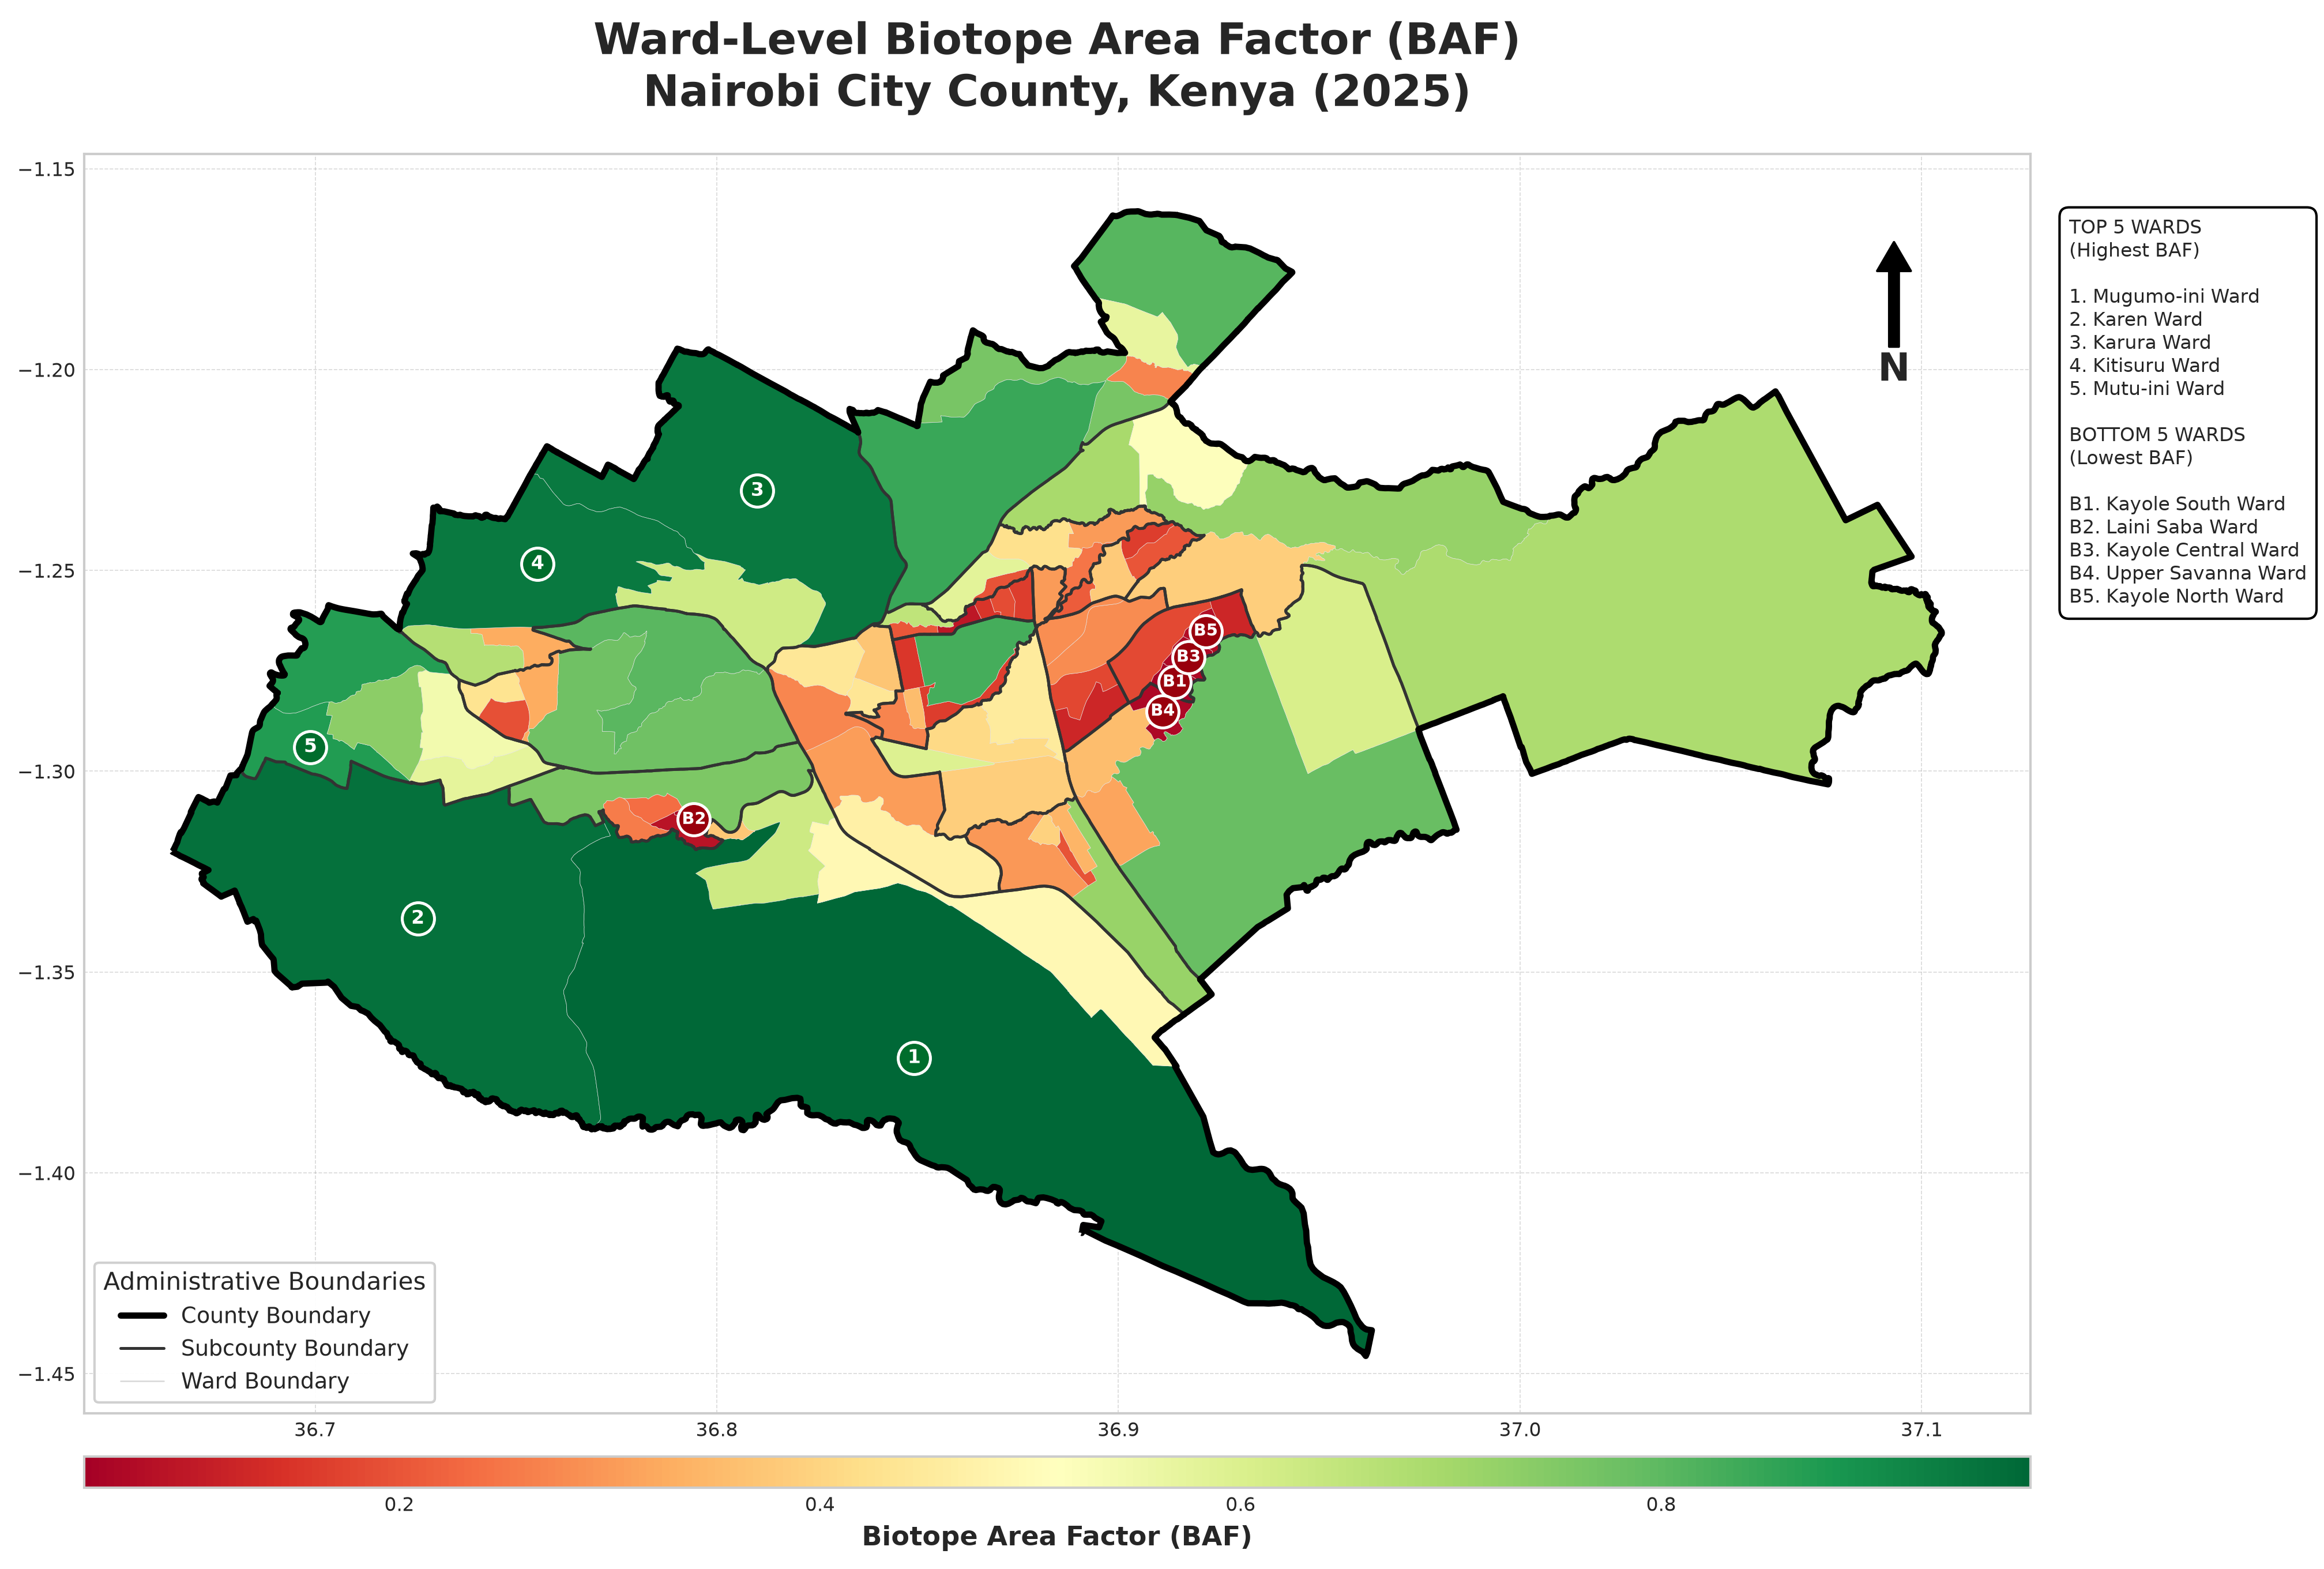
As Nairobi becomes more densely built up, buildings, car parks, paved compounds, and road infrastructure are steadily replacing open spaces, gardens, and vegetated areas. While this pattern of urban development supports housing and economic activity, it also transfers the responsibility of managing stormwater to public drainage systems that were never designed to accommodate such a rapid increase in surface runoff. The result is increasingly frequent local flooding, overloaded drainage networks, declining water quality, and rising infrastructure costs.
Traditionally, planning systems have responded through development standards such as plot ratios, site coverage limits, and open space requirements. These controls remain important, but they tell us little about how a site actually performs environmentally. Two developments can comply with the same zoning regulations while generating very different volumes of runoff depending on their vegetation cover, permeability, and surface treatment. As climate change intensifies flood risks, planners need tools that measure environmental performance rather than simply regulating building form.
One such tool is the Biotope Area Factor (BAF), developed through Berlin’s Landscape Plan in the late 1980s. Unlike conventional development control instruments that focus on density and coverage, BAF evaluates how effectively urban surfaces absorb, retain, and manage rainfall.
This article explores how the concept can be adapted to Nairobi’s 85 wards using satellite imagery and spatial analysis. The objective is not to replicate Berlin’s parcel-level methodology, but to test whether ecological performance can be measured consistently at city scale and used to support development control, flood-risk management, and future stormwater financing mechanisms.
Because parcel-level surface data is not available across Nairobi, the analysis relies on remotely sensed classification of permeable and non-permeable surfaces. The resulting BAF values should therefore be interpreted as a city-wide screening tool rather than parcel-level calculations.
Using Sentinel-2 imagery, GIS, and Python, the analysis identifies where ecological capacity remains strong, where it has been eroded by urbanisation, and what this means for stormwater management across the city.
The full methodology, code, and reproducible workflow are available on GitHub:
GitHub Repository: Siam3h/beyond-zoning
Ward-Level Ecological Performance
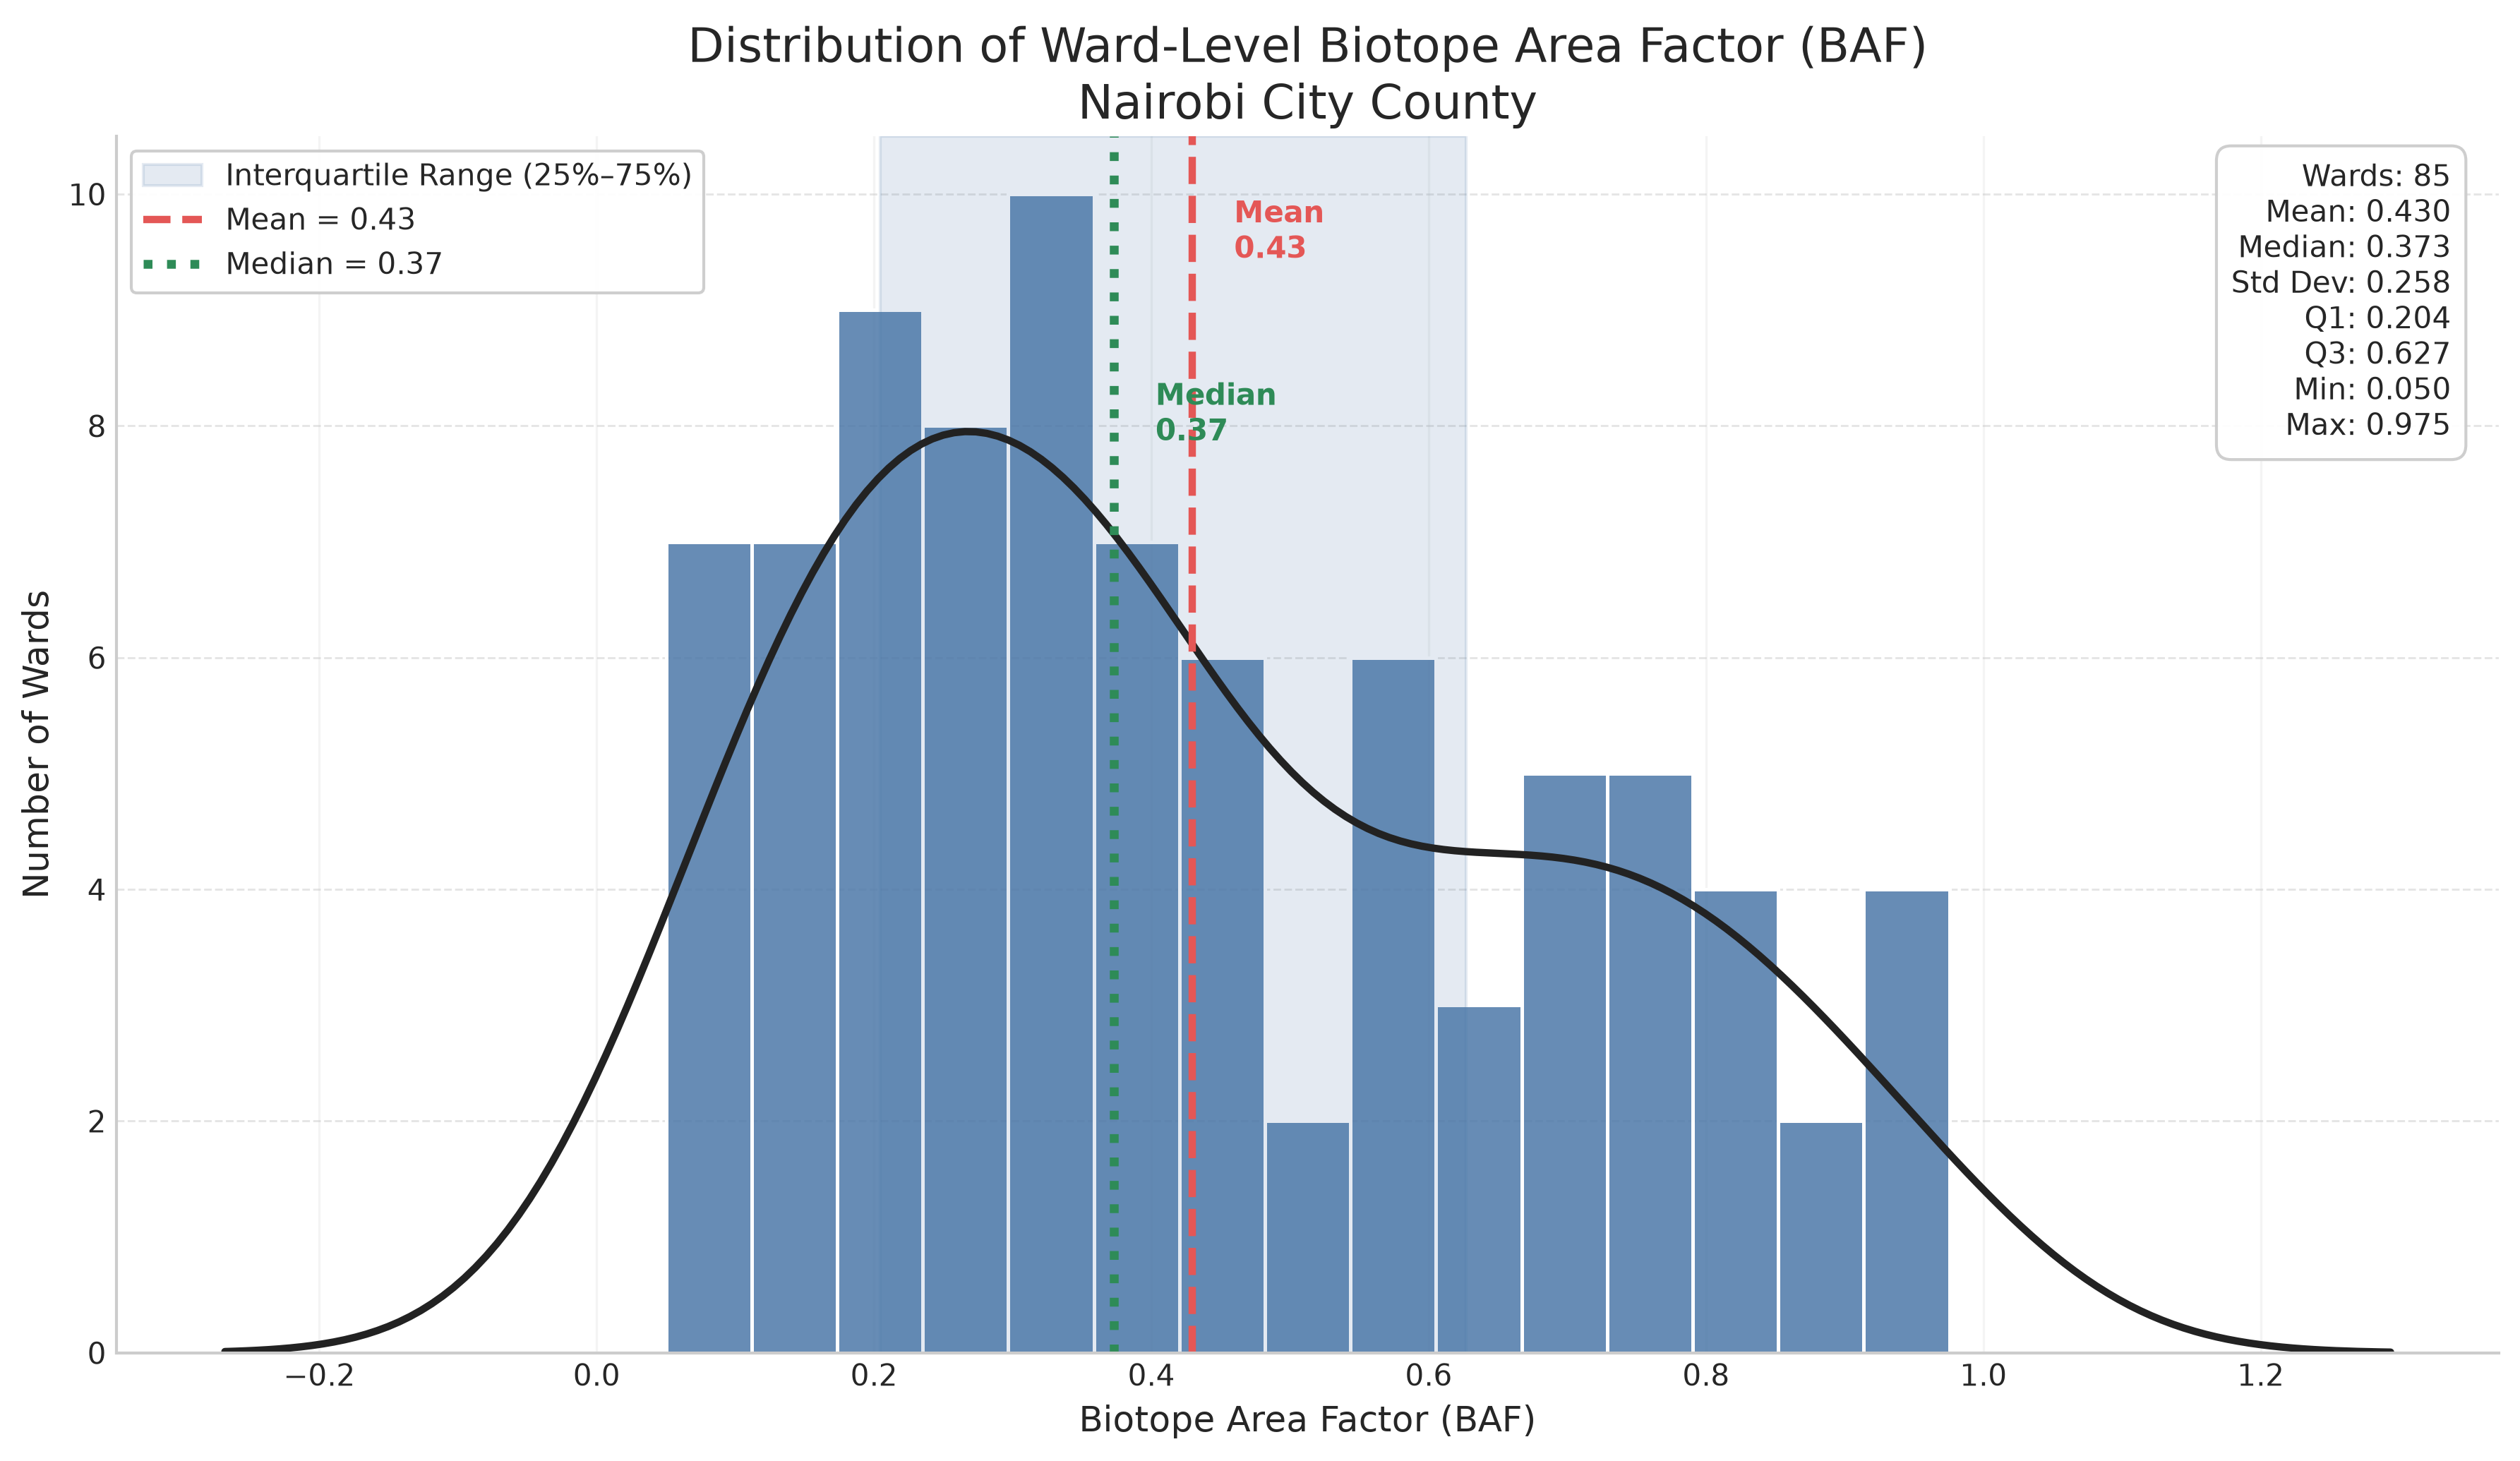
Citywide, BAF scores are uneven. The average score is 0.43, meaning that less than half of Nairobi’s land surface is functioning effectively in terms of infiltration and stormwater retention. The median is even lower at 0.37, indicating that a small number of highly vegetated wards lift the county average.
Scores range from 0.05 in the most sealed wards to 0.98 in the greenest parts of the city. Dense, paved neighbourhoods transfer rainfall directly into drainage systems, while wards with large areas of vegetation and open space absorb and slow runoff.
A quarter of Nairobi’s wards record BAF values below 0.20, while the top quartile exceeds 0.63. This ecological capacity is highly concentrated rather than evenly distributed. Wards such as Mugumo-ini, Karen, Karura, and Kitisuru record some of the highest scores in the county, reflecting large plot sizes, substantial tree cover, and relatively low levels of surface sealing.
From Ecological Performance to Stormwater Tariffs
To explore how ecological conditions could inform development control, the ward-level BAF results were translated into four conceptual stormwater tariff bands.
| Tariff Band | BAF Threshold |
|---|---|
| Exempt | ≥ 0.70 |
| Low | 0.50 – 0.69 |
| Medium | 0.30 – 0.49 |
| High | < 0.30 |
Under a conceptual stormwater financing framework, areas that generate more runoff would face greater obligations for mitigation, while areas already providing strong environmental functions would face lower obligations or be exempt altogether.
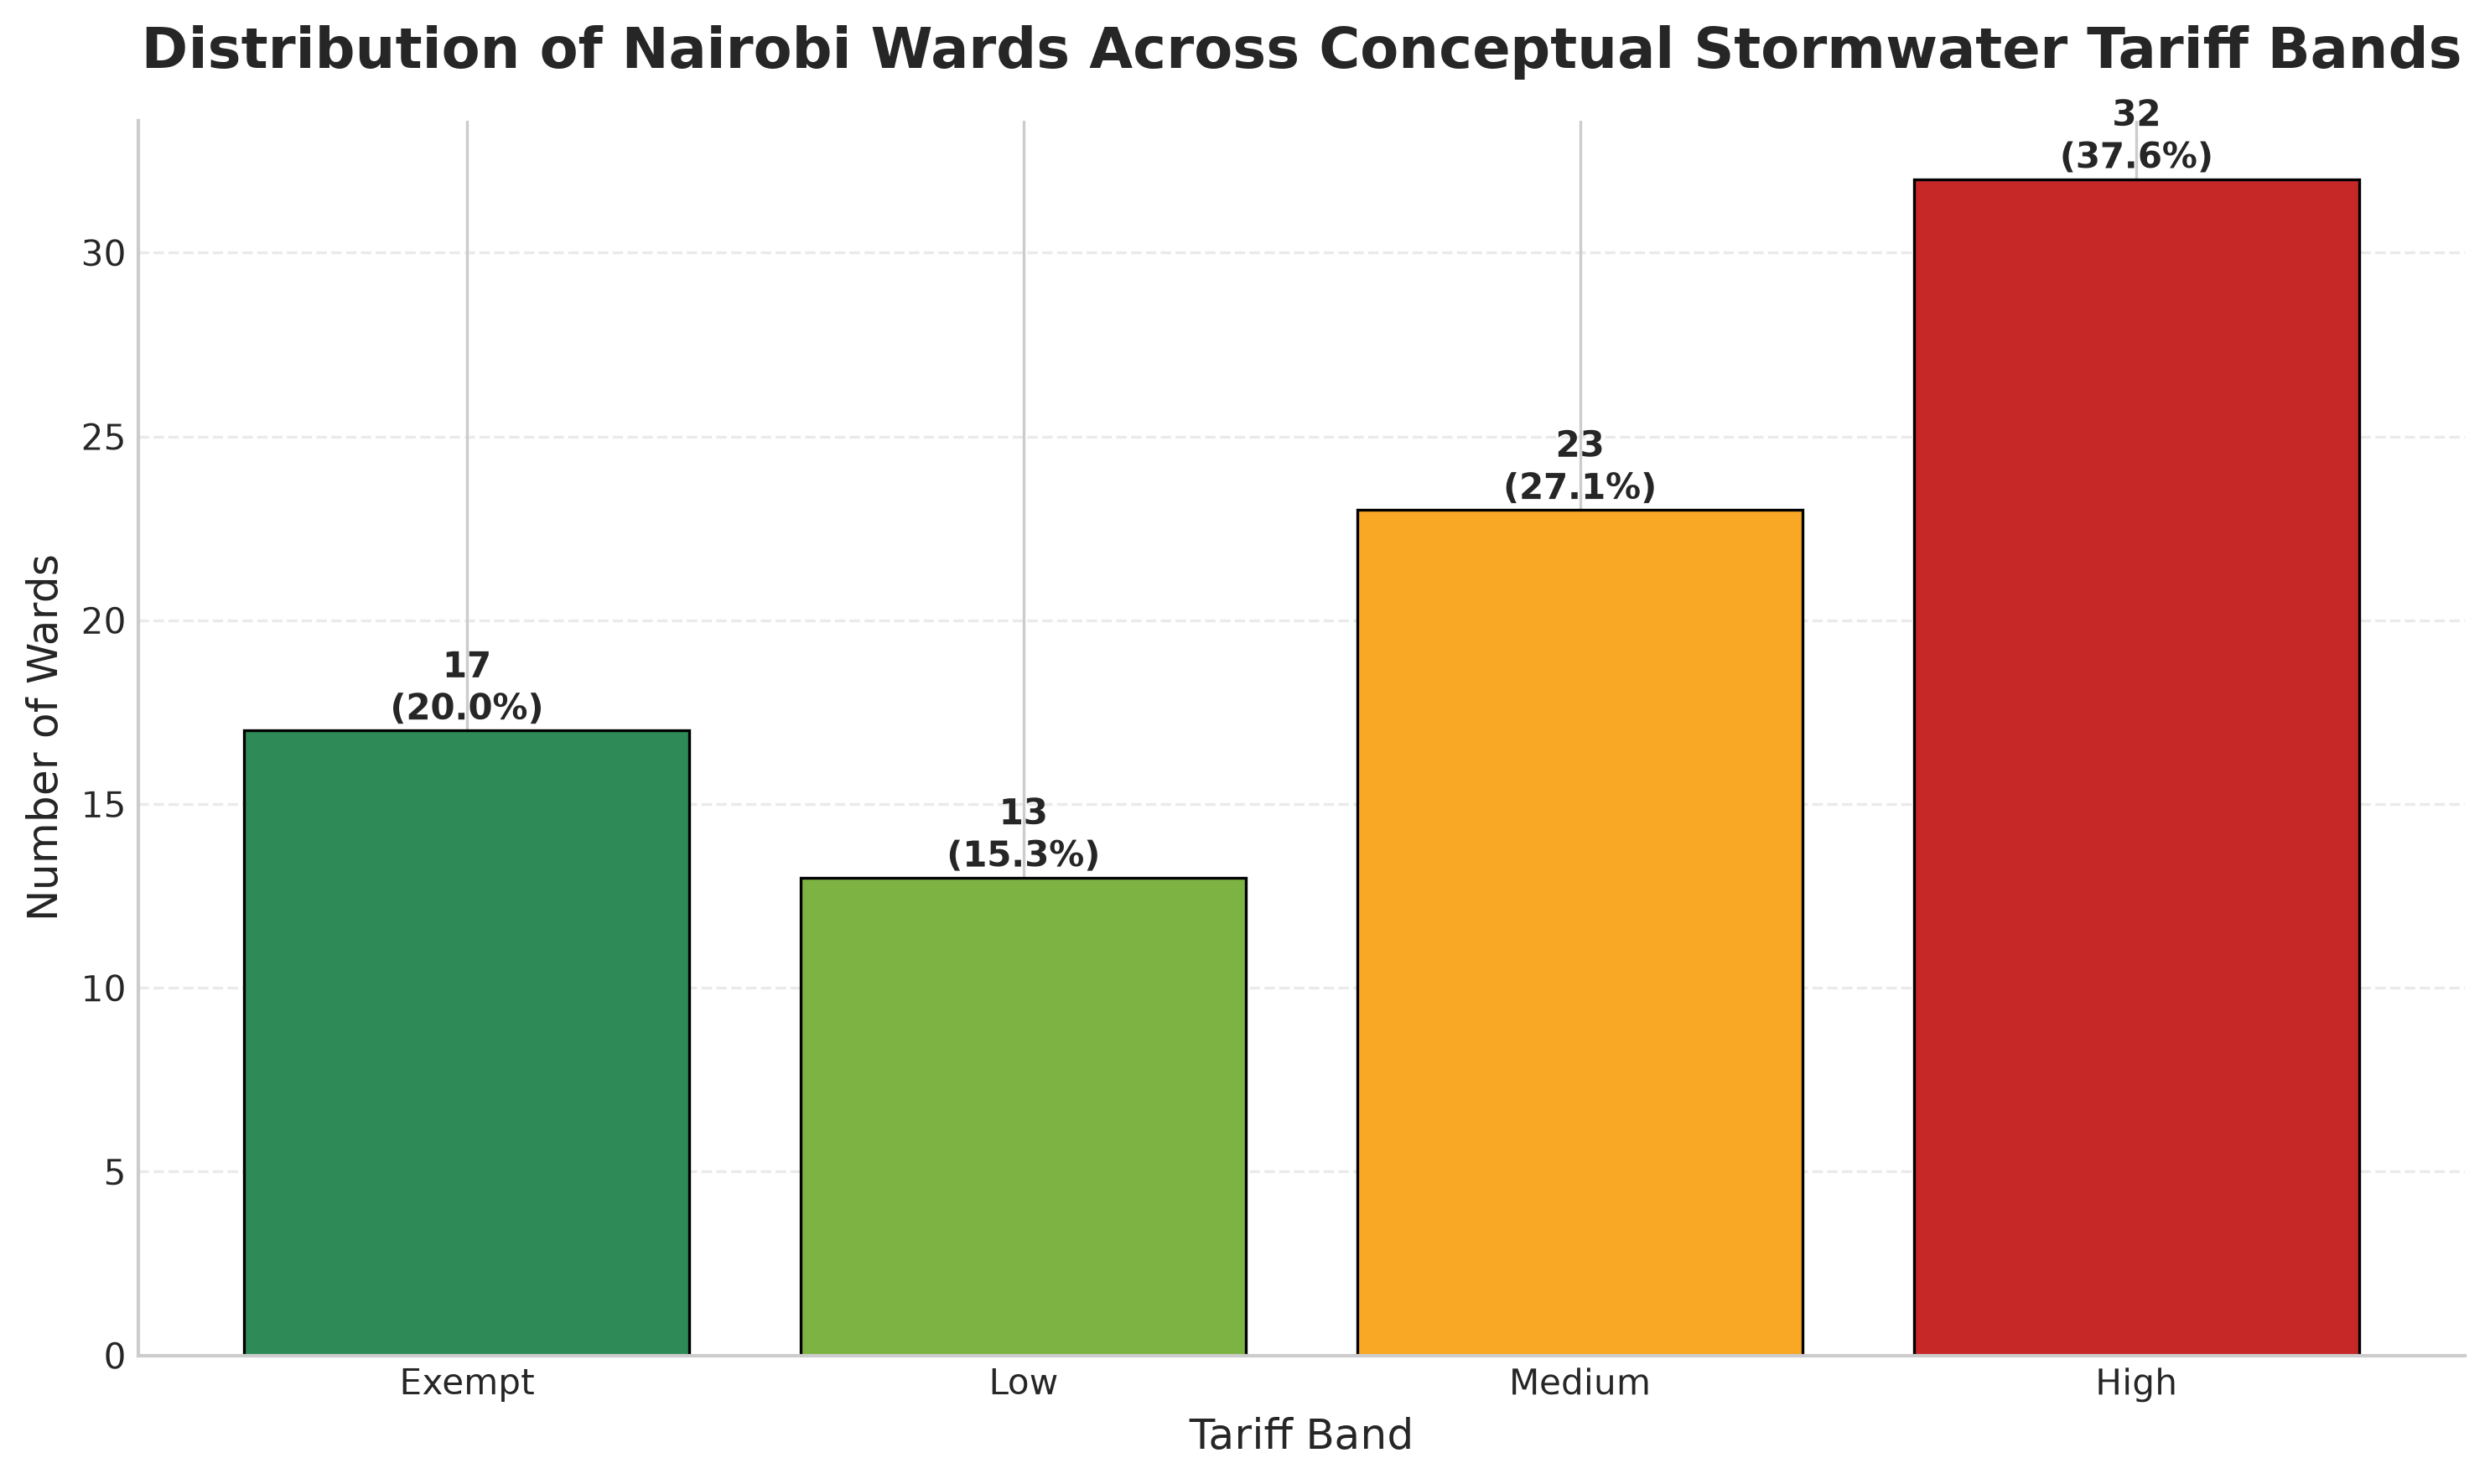
The largest group falls within the High Tariff Band, which contains 32 wards (37.6%). These wards have BAF values below 0.30, indicating limited infiltration capacity and a high degree of surface sealing. More than one-third of Nairobi’s wards therefore have relatively little remaining capacity to manage rainfall naturally.
A further 23 wards (27.1%) fall within the Medium Tariff Band. Together, the Medium and High bands account for nearly two-thirds of all wards in the county.
At the opposite end of the spectrum, 17 wards (20.0%) fall within the Exempt Band. These include Mugumo-ini, Karen, Karura, Kitisuru, and Mutu-ini, where vegetation and open space continue to provide strong stormwater regulation functions. Another 13 wards (15.3%) fall within the Low Tariff Band.
Population Exposure to Ecological Deficit
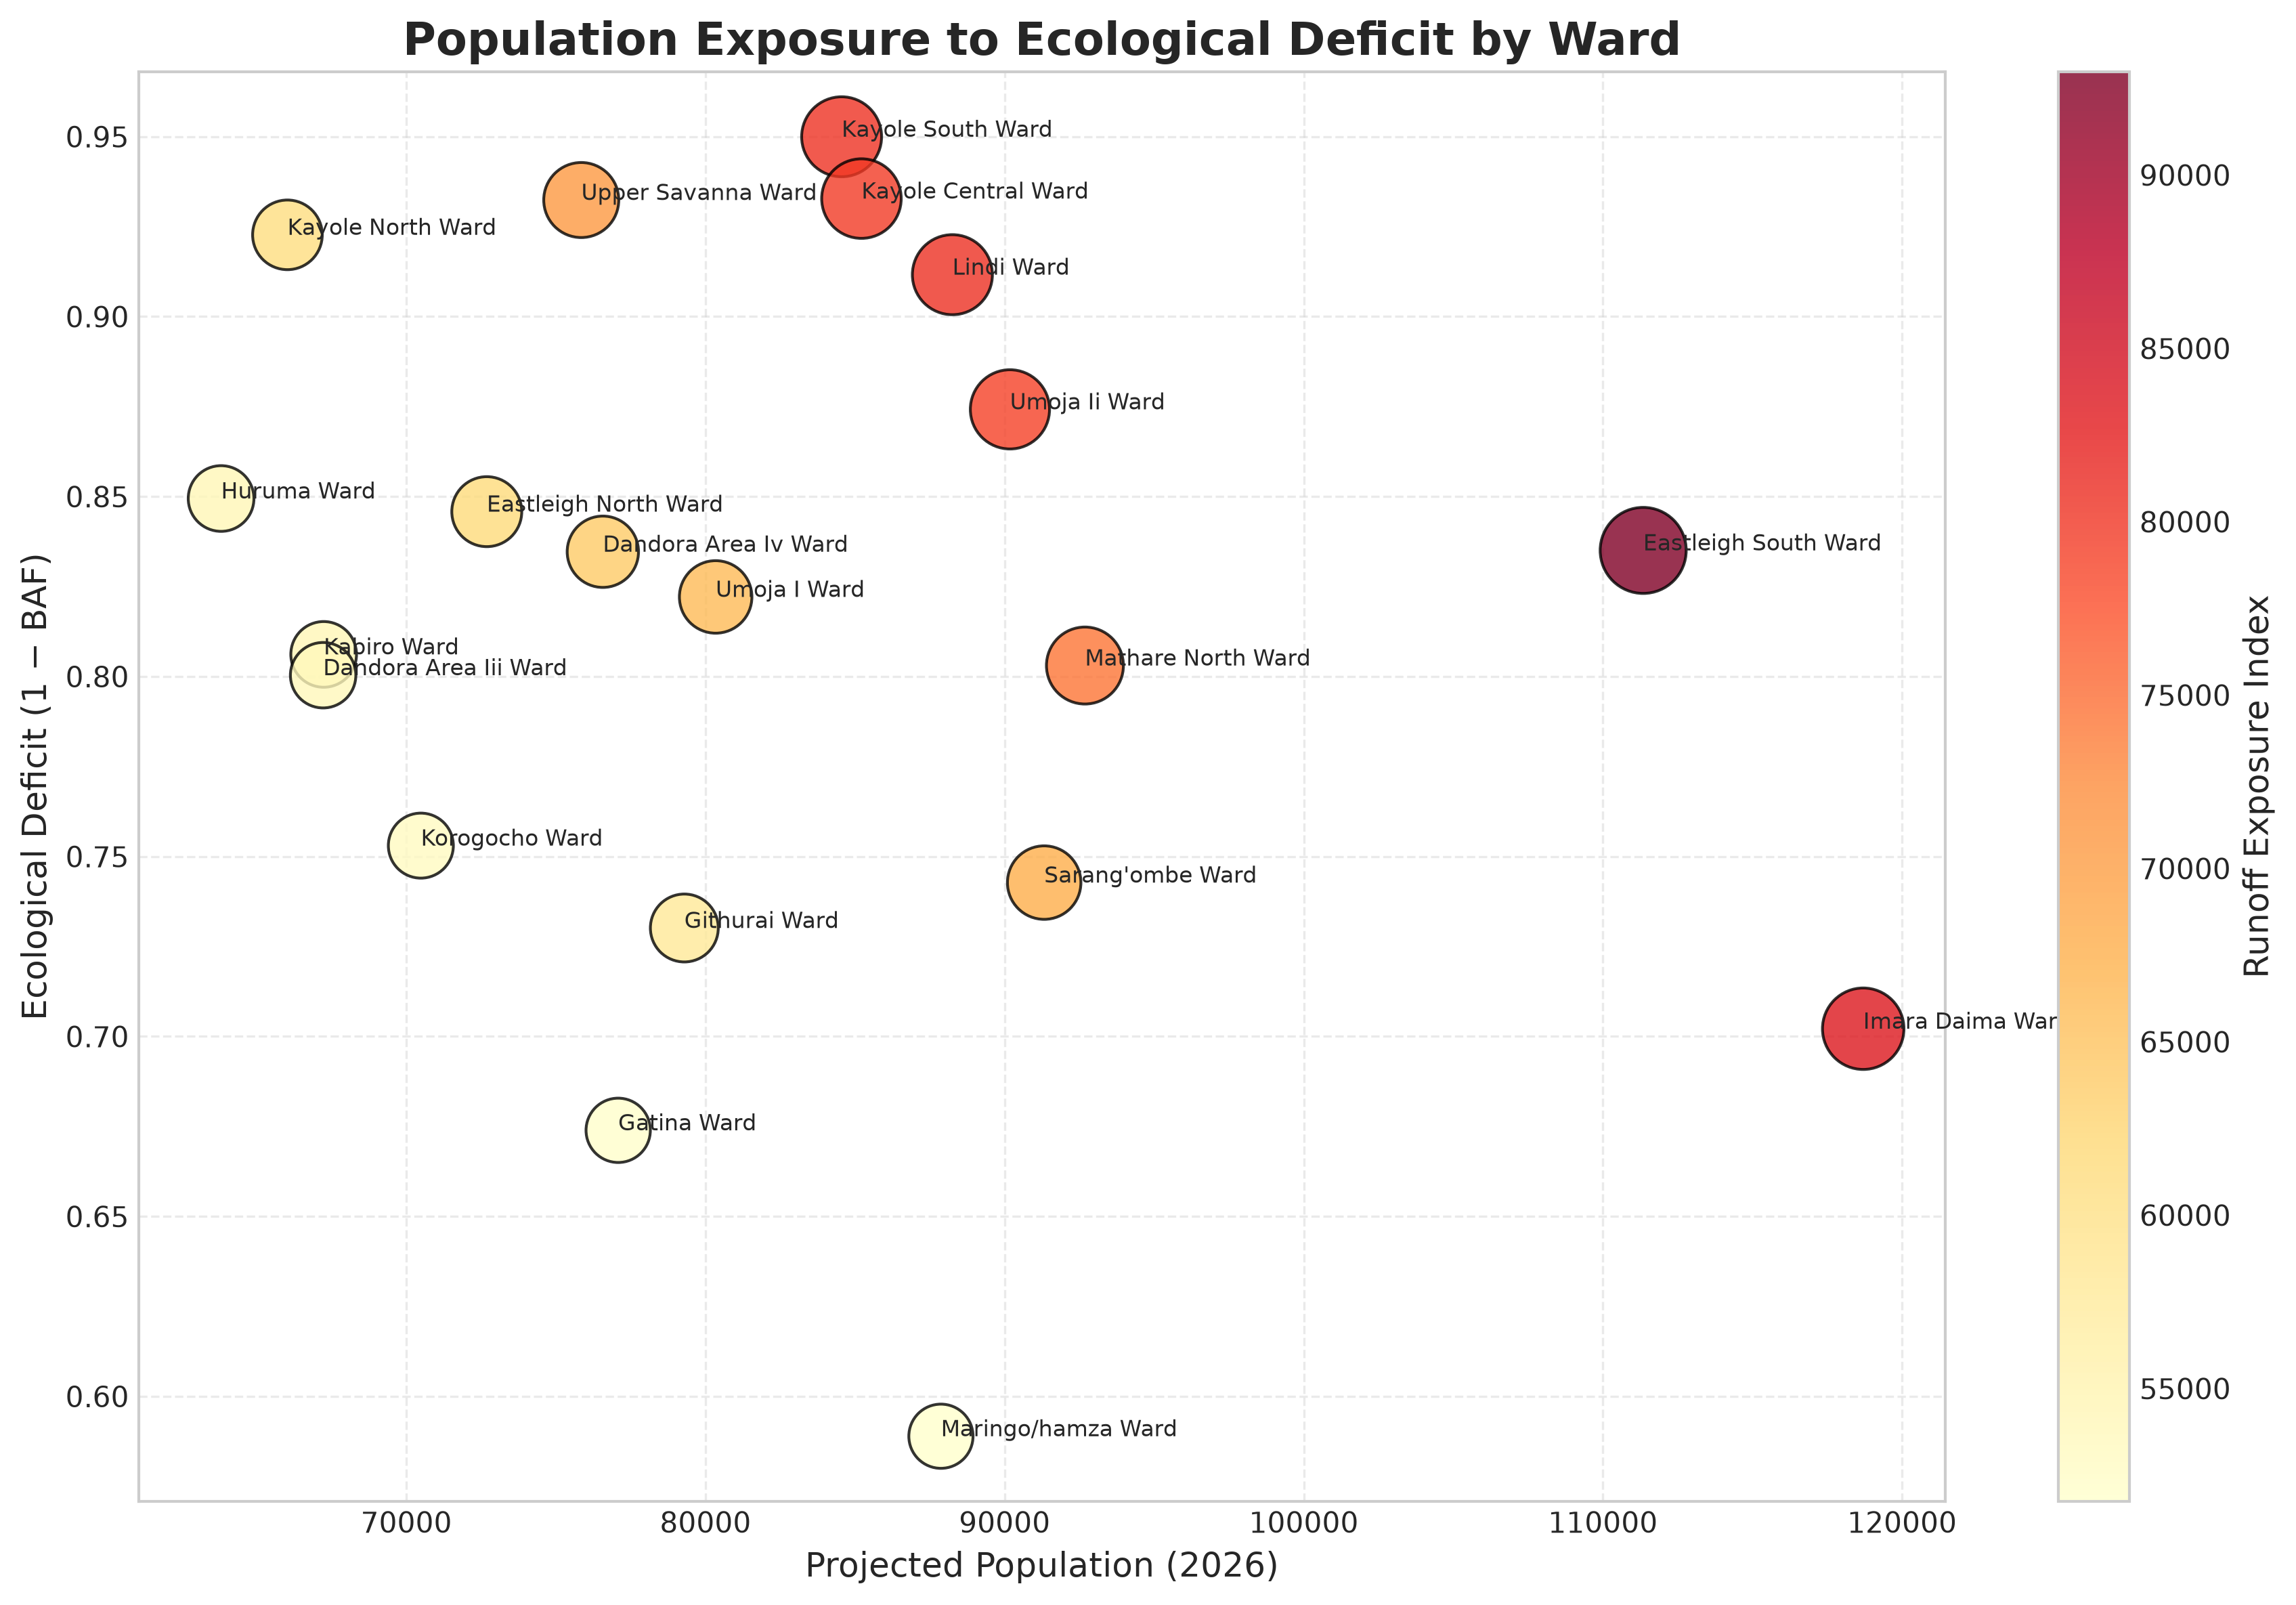
The runoff exposure analysis combines ecological deficit (1 − BAF) with projected population to identify wards where large numbers of residents are exposed to highly sealed urban environments.
The highest exposure scores are concentrated in eastern Nairobi and parts of Kibra and Mathare. Lindi, Kayole South, Kayole Central, Umoja II, and Upper Savanna emerge as the most exposed wards. While several wards record similarly high ecological deficits, population size plays a major role in determining overall exposure.
A clear cluster appears across the Kayole–Embakasi corridor, where multiple wards rank among the county’s most exposed locations. This suggests that stormwater risk is shaped not only by individual developments but by the cumulative effects of urban form and widespread surface sealing.
The correlation analysis reinforces this finding. Runoff exposure is more strongly associated with ecological deficit (r = 0.805) than population alone (r = 0.677), indicating that the loss of permeable and vegetated surfaces is the primary driver of exposure, while population density amplifies its impacts.
Development Control Implications
The results show that a one-size-fits-all approach to stormwater management is unlikely to work across Nairobi. Ecological conditions vary considerably between wards, meaning development controls should be calibrated to local runoff risks and infiltration capacity.
Thirty-two of Nairobi’s 85 wards (37.6%) fall within the High Tariff Band, indicating critically low capacity to absorb rainfall. In these areas, flood risk is driven as much by land-use patterns and surface sealing as it is by drainage infrastructure.
Priority interventions for High Tariff wards could include:
- Minimum permeability requirements for new developments.
- Reduced maximum site coverage ratios.
- Stormwater impact fees linked to ecological deficit.
- Incentives for green roofs and rainwater harvesting.
- Permeable paving, bioswales, rain gardens, and urban tree planting.
- Targeted investment in local drainage and green infrastructure projects.
The runoff exposure analysis further suggests that investment should be prioritised in wards where ecological deficits coincide with large populations, particularly within parts of Kayole, Embakasi, Kibra, and Mathare.
Implementation will not be straightforward. Funding constraints, technical capacity limitations, and stakeholder resistance may slow adoption. Any future stormwater financing mechanism would therefore need to be accompanied by clear regulatory guidance, capacity building, and transparent reinvestment of revenues into local flood mitigation and greening projects.
At this stage, the BAF should be viewed as a screening and decision-support tool rather than a regulatory standard. Its value lies in helping planners identify where ecological capacity has been most eroded and where interventions are likely to deliver the greatest benefit.
Limitations and Methodological Notes
Several limitations should be acknowledged:
- The analysis uses a simplified BAF proxy rather than Berlin’s full parcel-level methodology.
- Ecological performance is derived from a binary classification of vegetated and non-vegetated surfaces using Sentinel-2 imagery.
- Different surface types are not assigned separate ecological weights.
- Results are aggregated at ward level and do not capture parcel-scale variation.
- Population figures are projected estimates rather than observed counts.
- The analysis has not been validated against detailed land-cover surveys or historical flood records.
The findings should therefore be interpreted as a city-wide screening and planning tool rather than a regulatory standard.
Future work could incorporate higher-resolution imagery, cadastral datasets, field validation, and locally calibrated ecological weighting factors.
No comments yet. Be the first to comment.